Monti APM Redesign
For the past year, we've been slowly working on a redesign of Monti APM. It touches and improves almost every aspect of Monti APM, and I want to share some of the details.
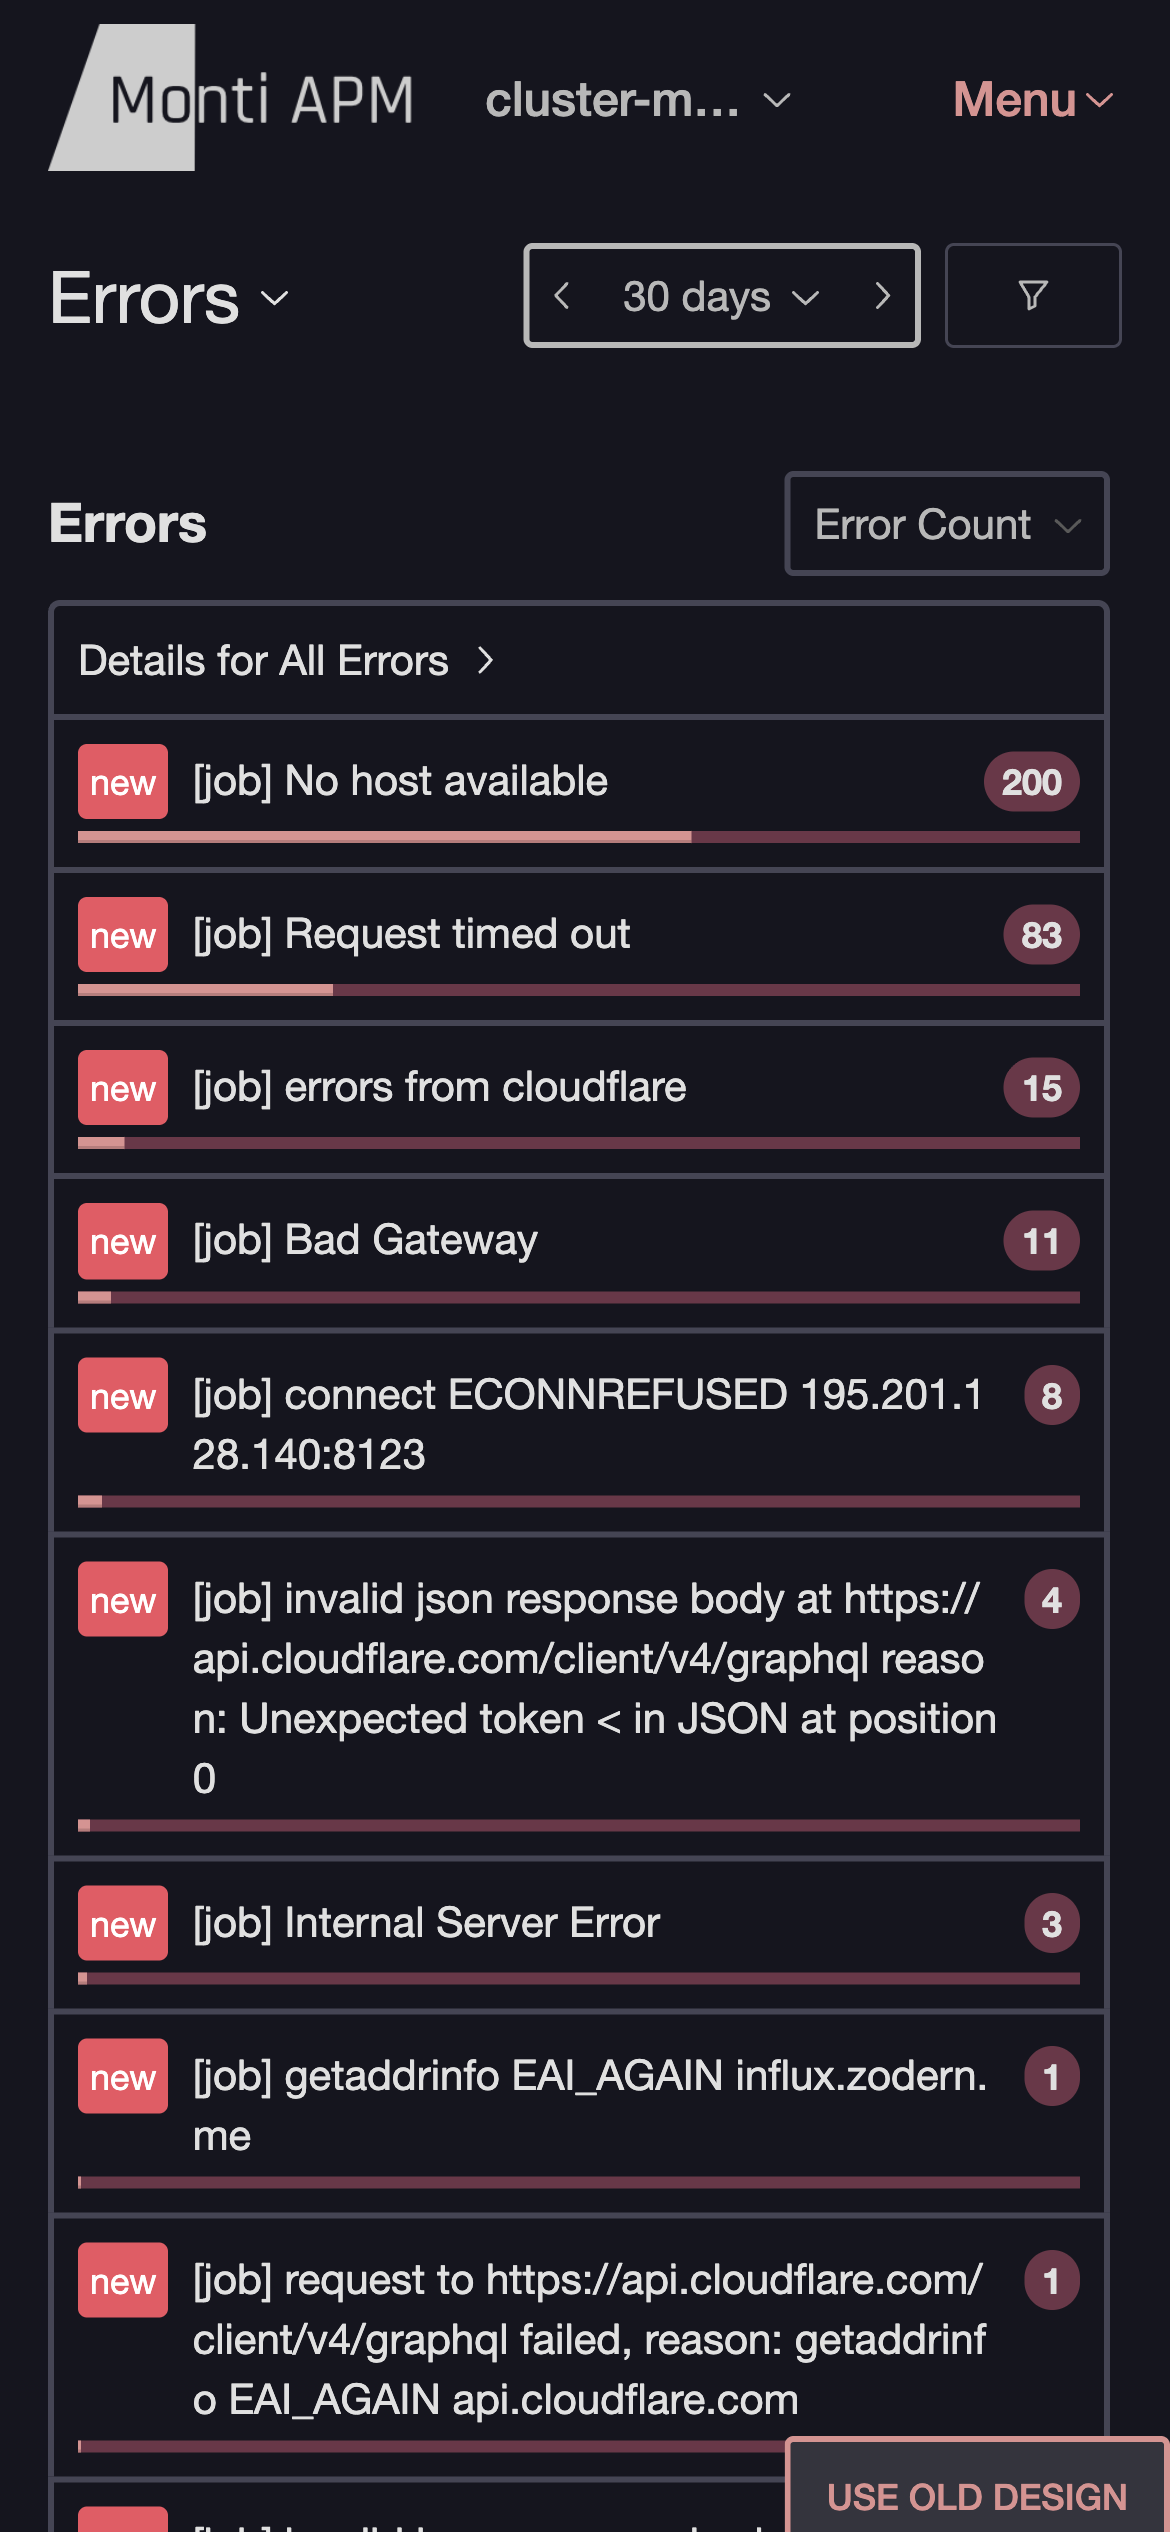
The new design is available to use starting today. When logged in, there is a banner at the top of the screen to switch to the new design. You can switch back to the old design at any time if you run into problems.
Why redesign? #
There were a few issues with the current design we wanted to fix:
- the old design had started to look dated
- there were many places the old design had flaws or needed a lot of polish
- we needed a new layout that had space for features on our roadmap
- the old design did not work on mobile
- During previous redesign attempts we realized the visual design could be simplified without losing information density
I think this new design meets all of these goals. I'm excited to show it to you.
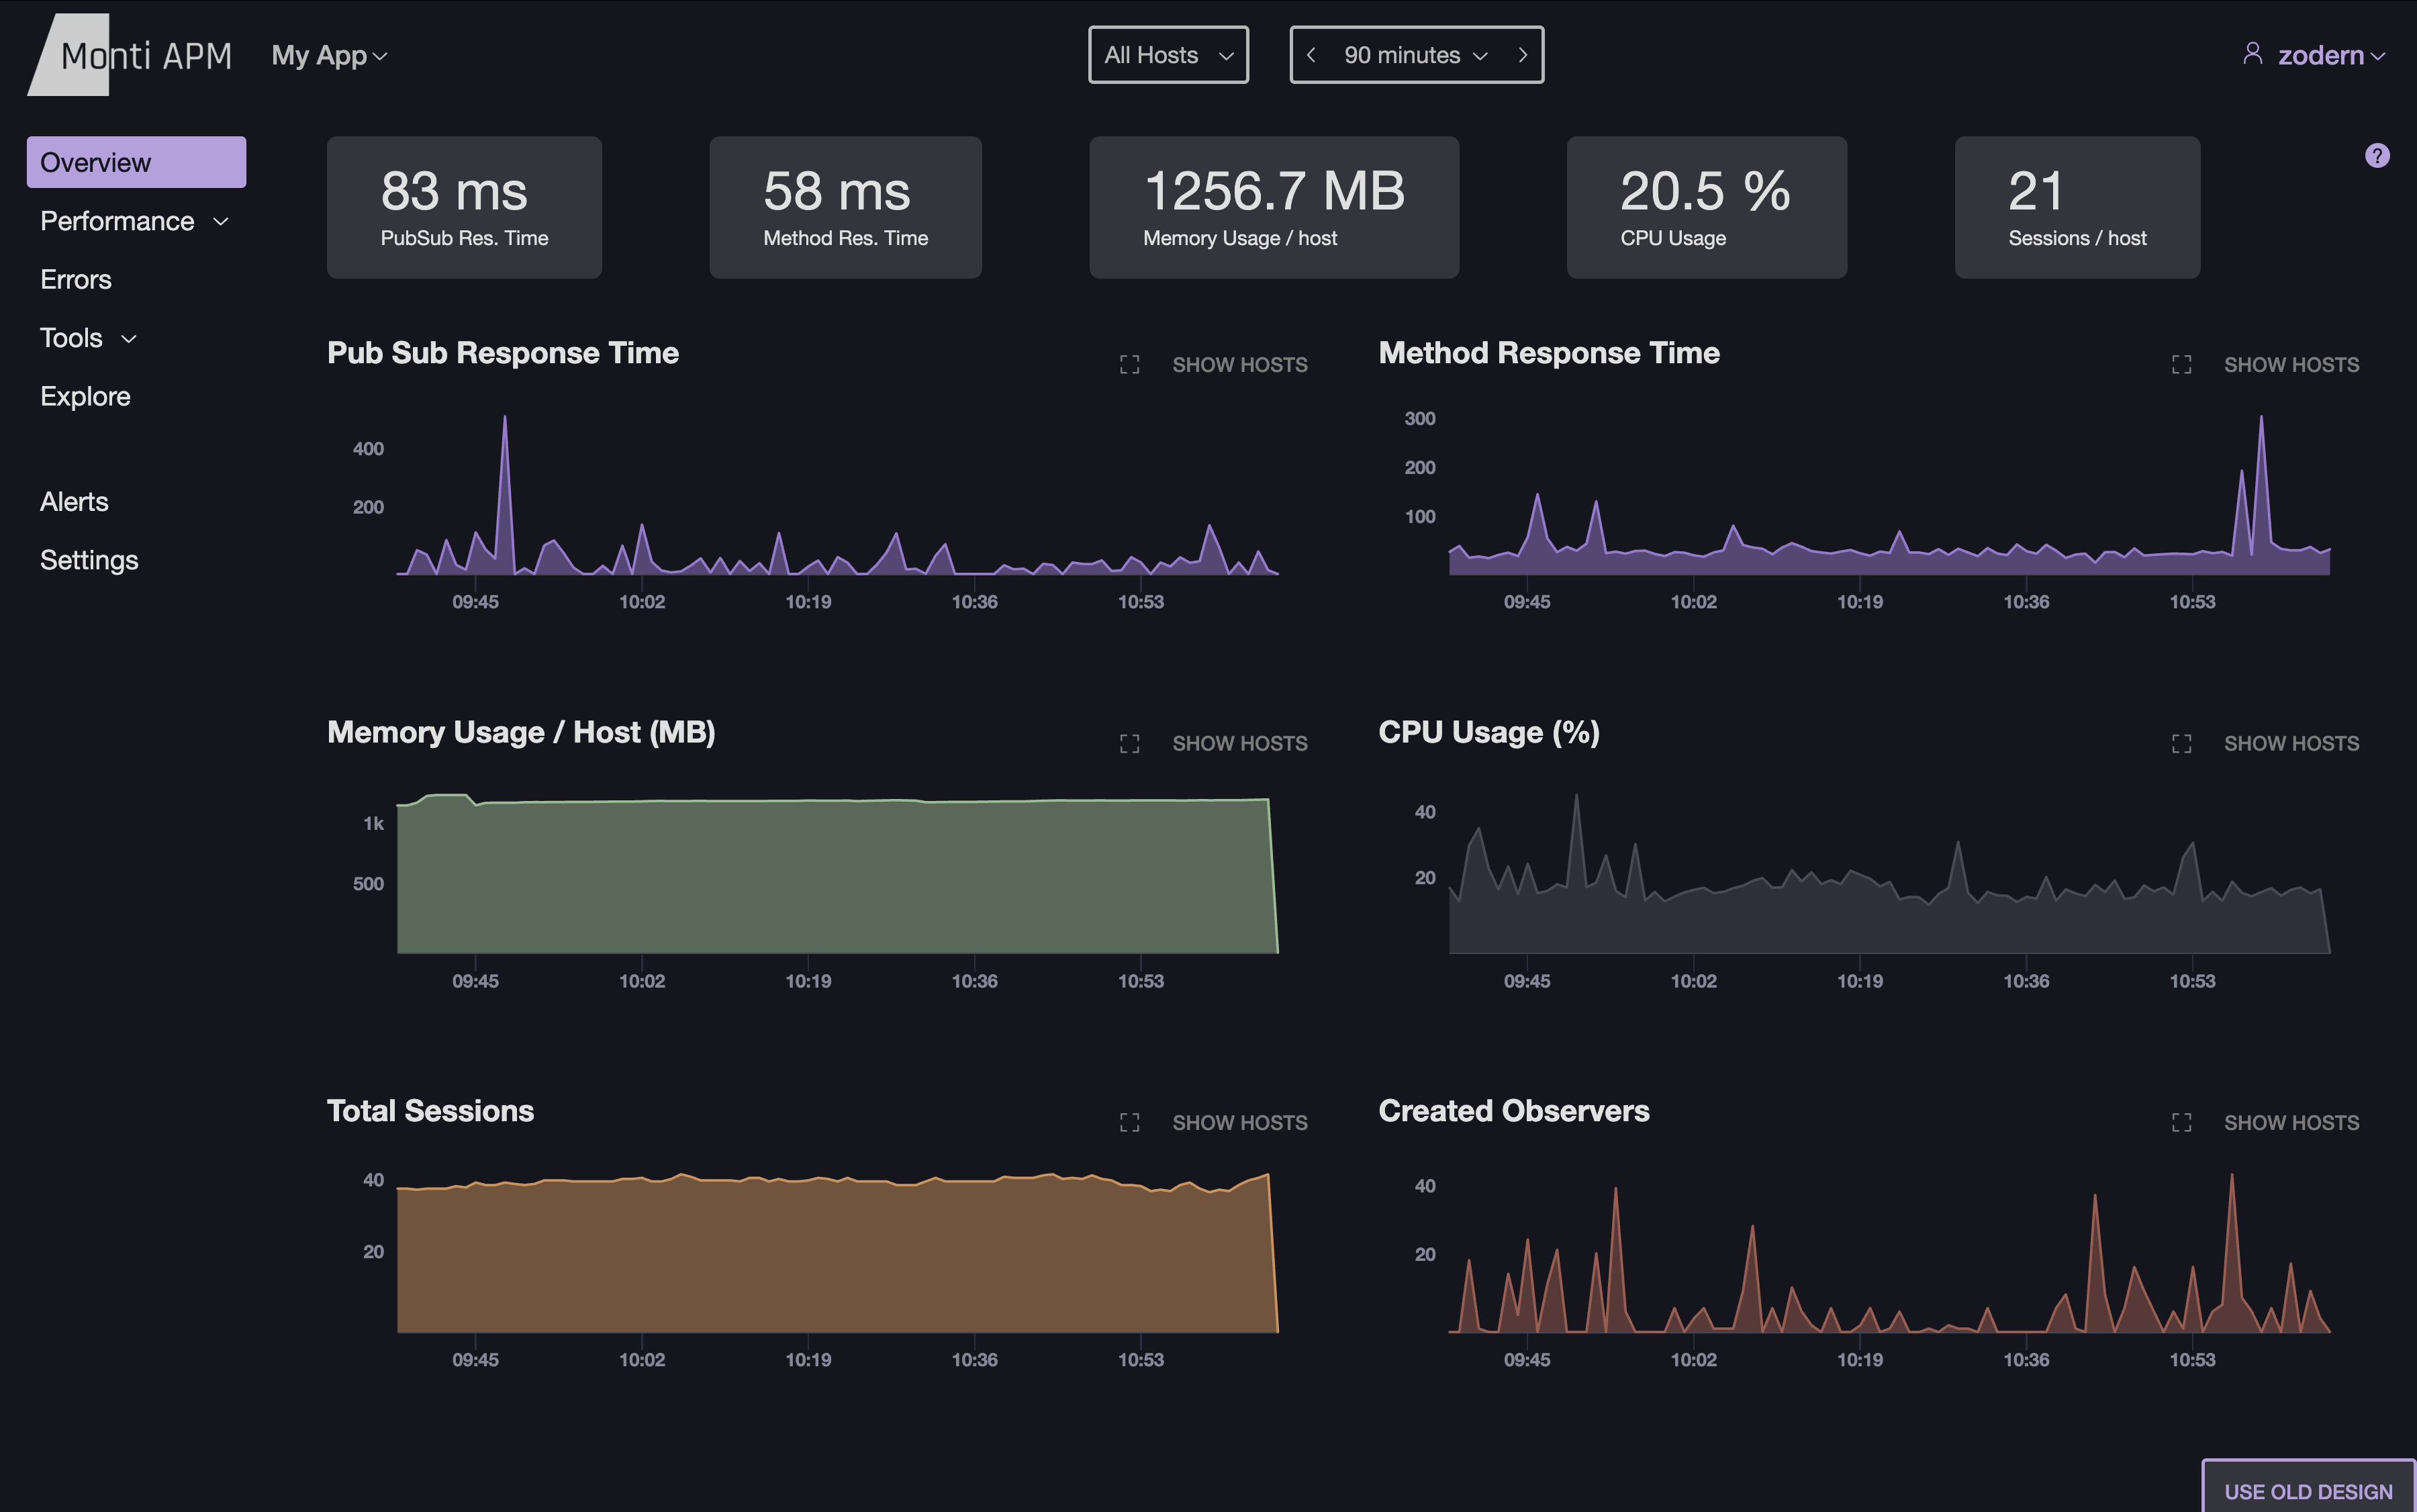
App Overview #
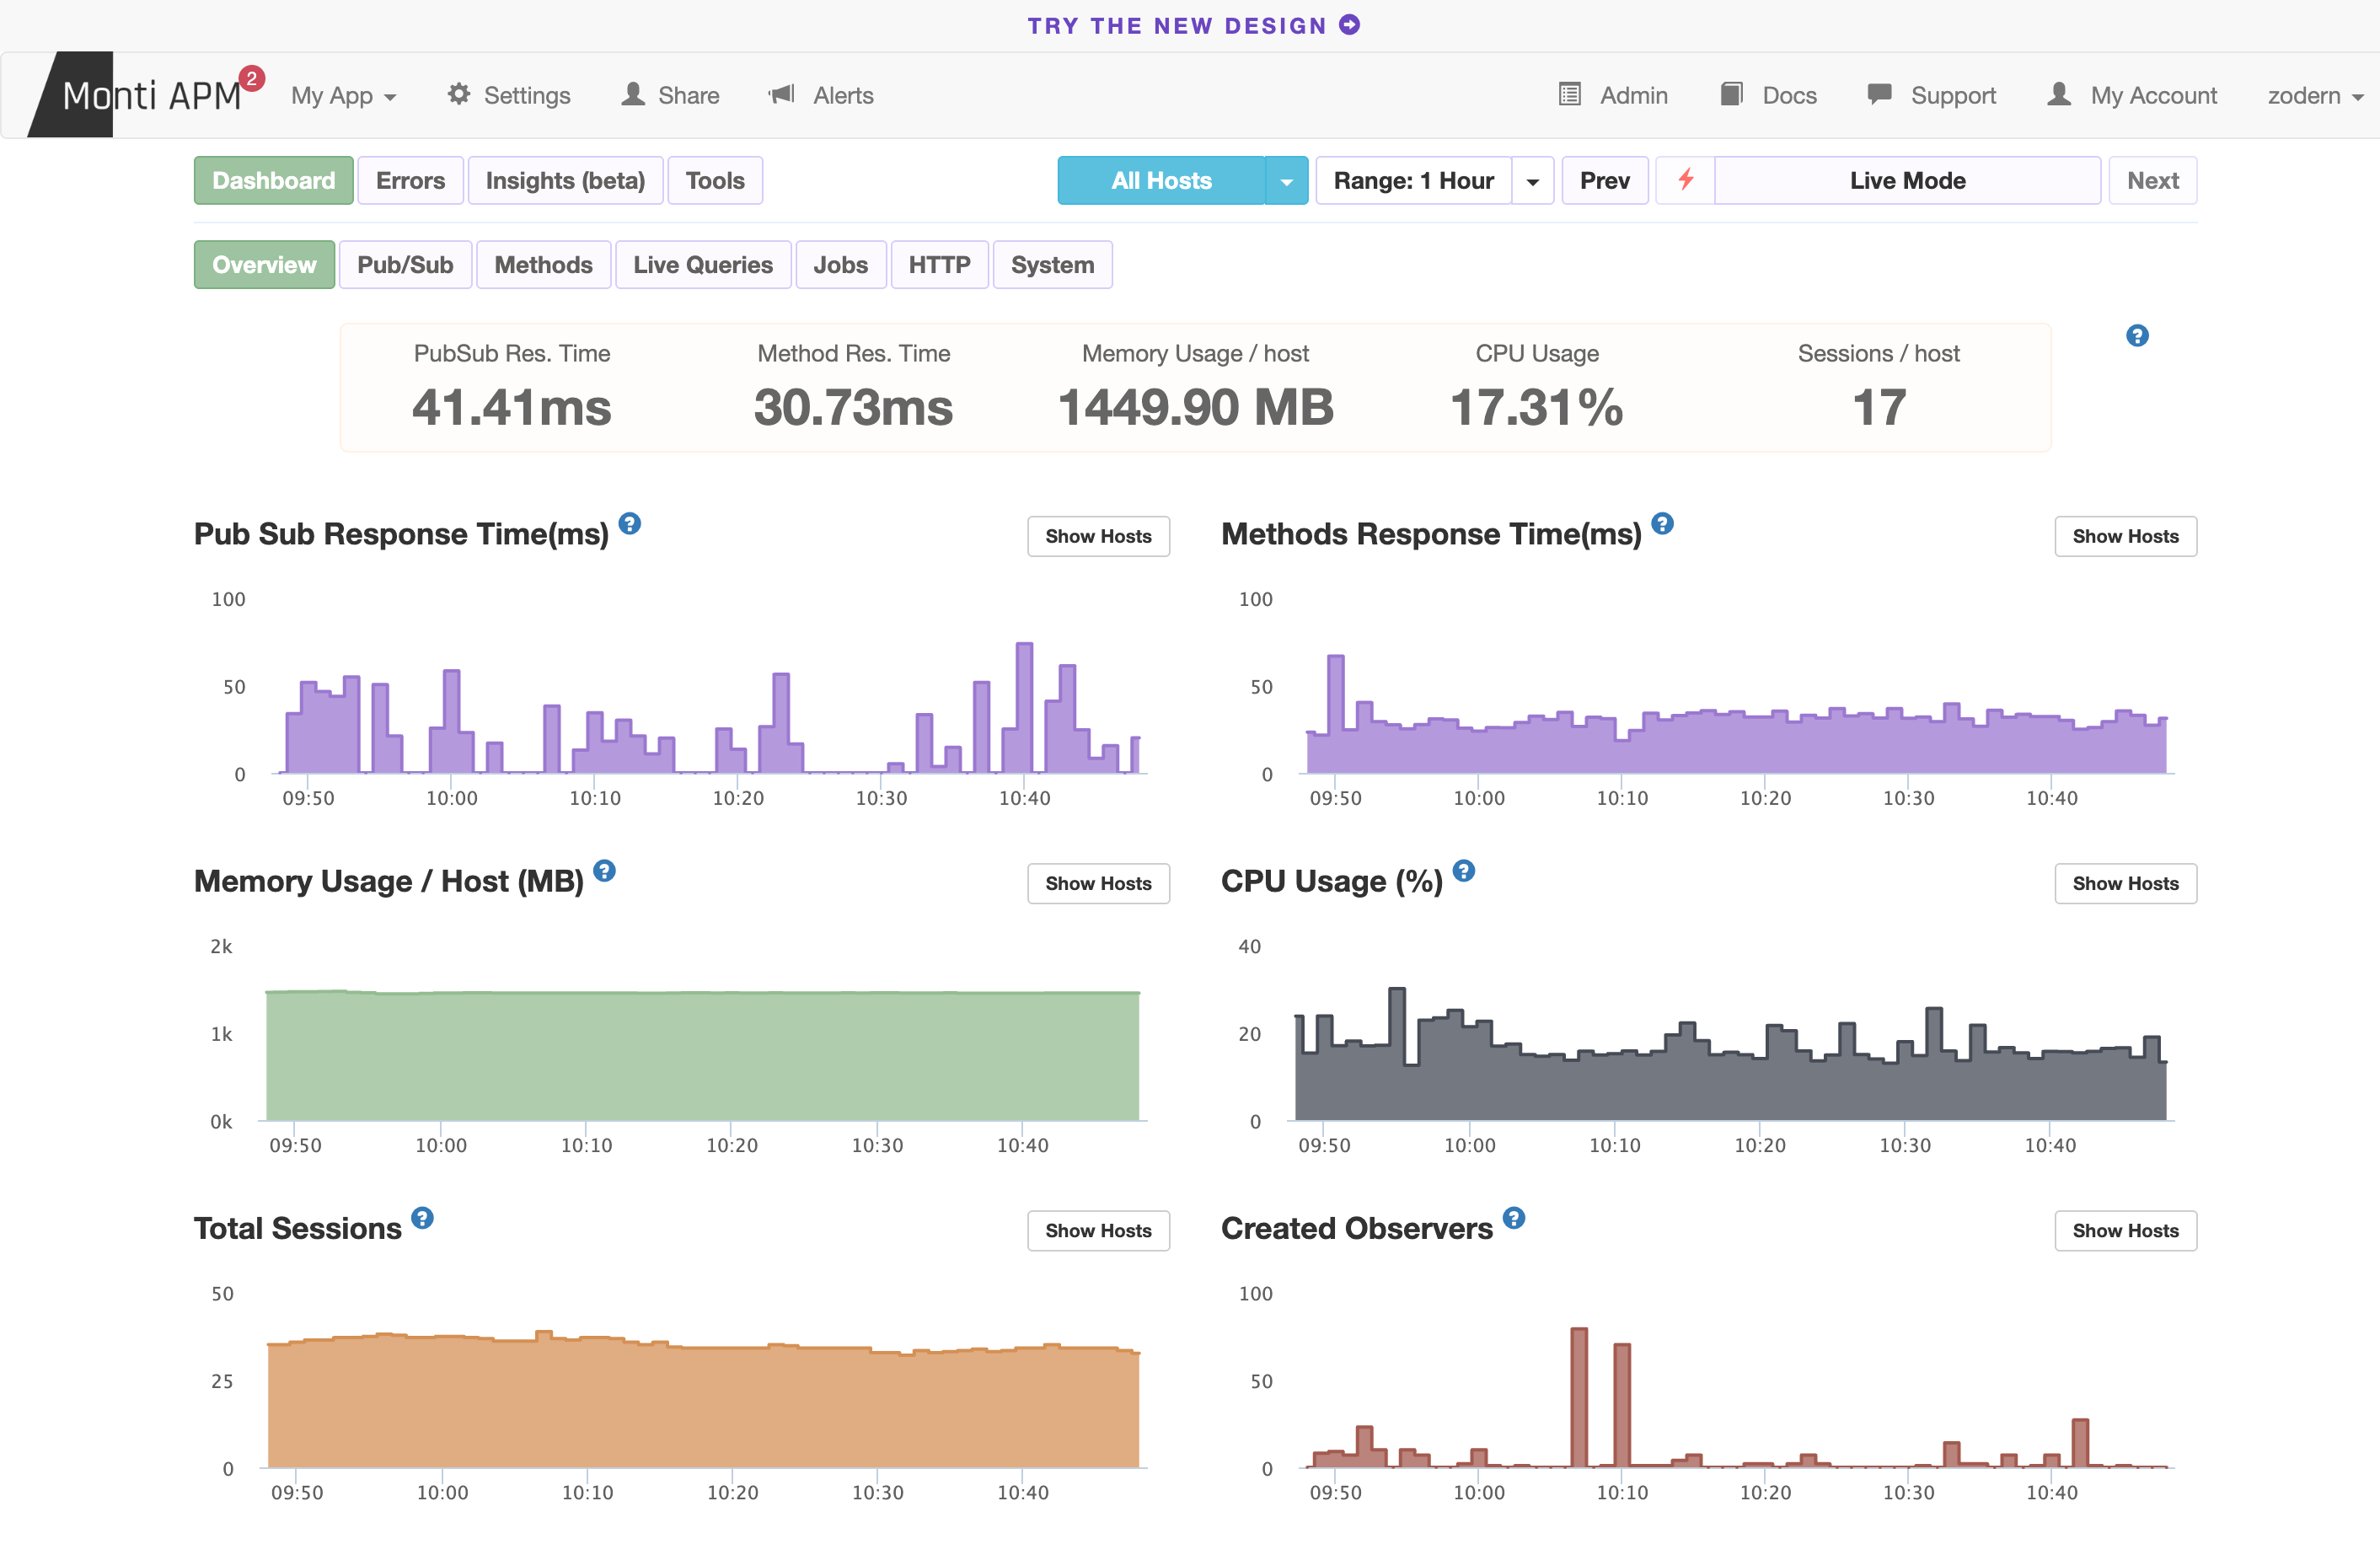
The main screen in Monti APM is the overview dashboard for an app. Here is what it looks like currently:
And here is the new design:
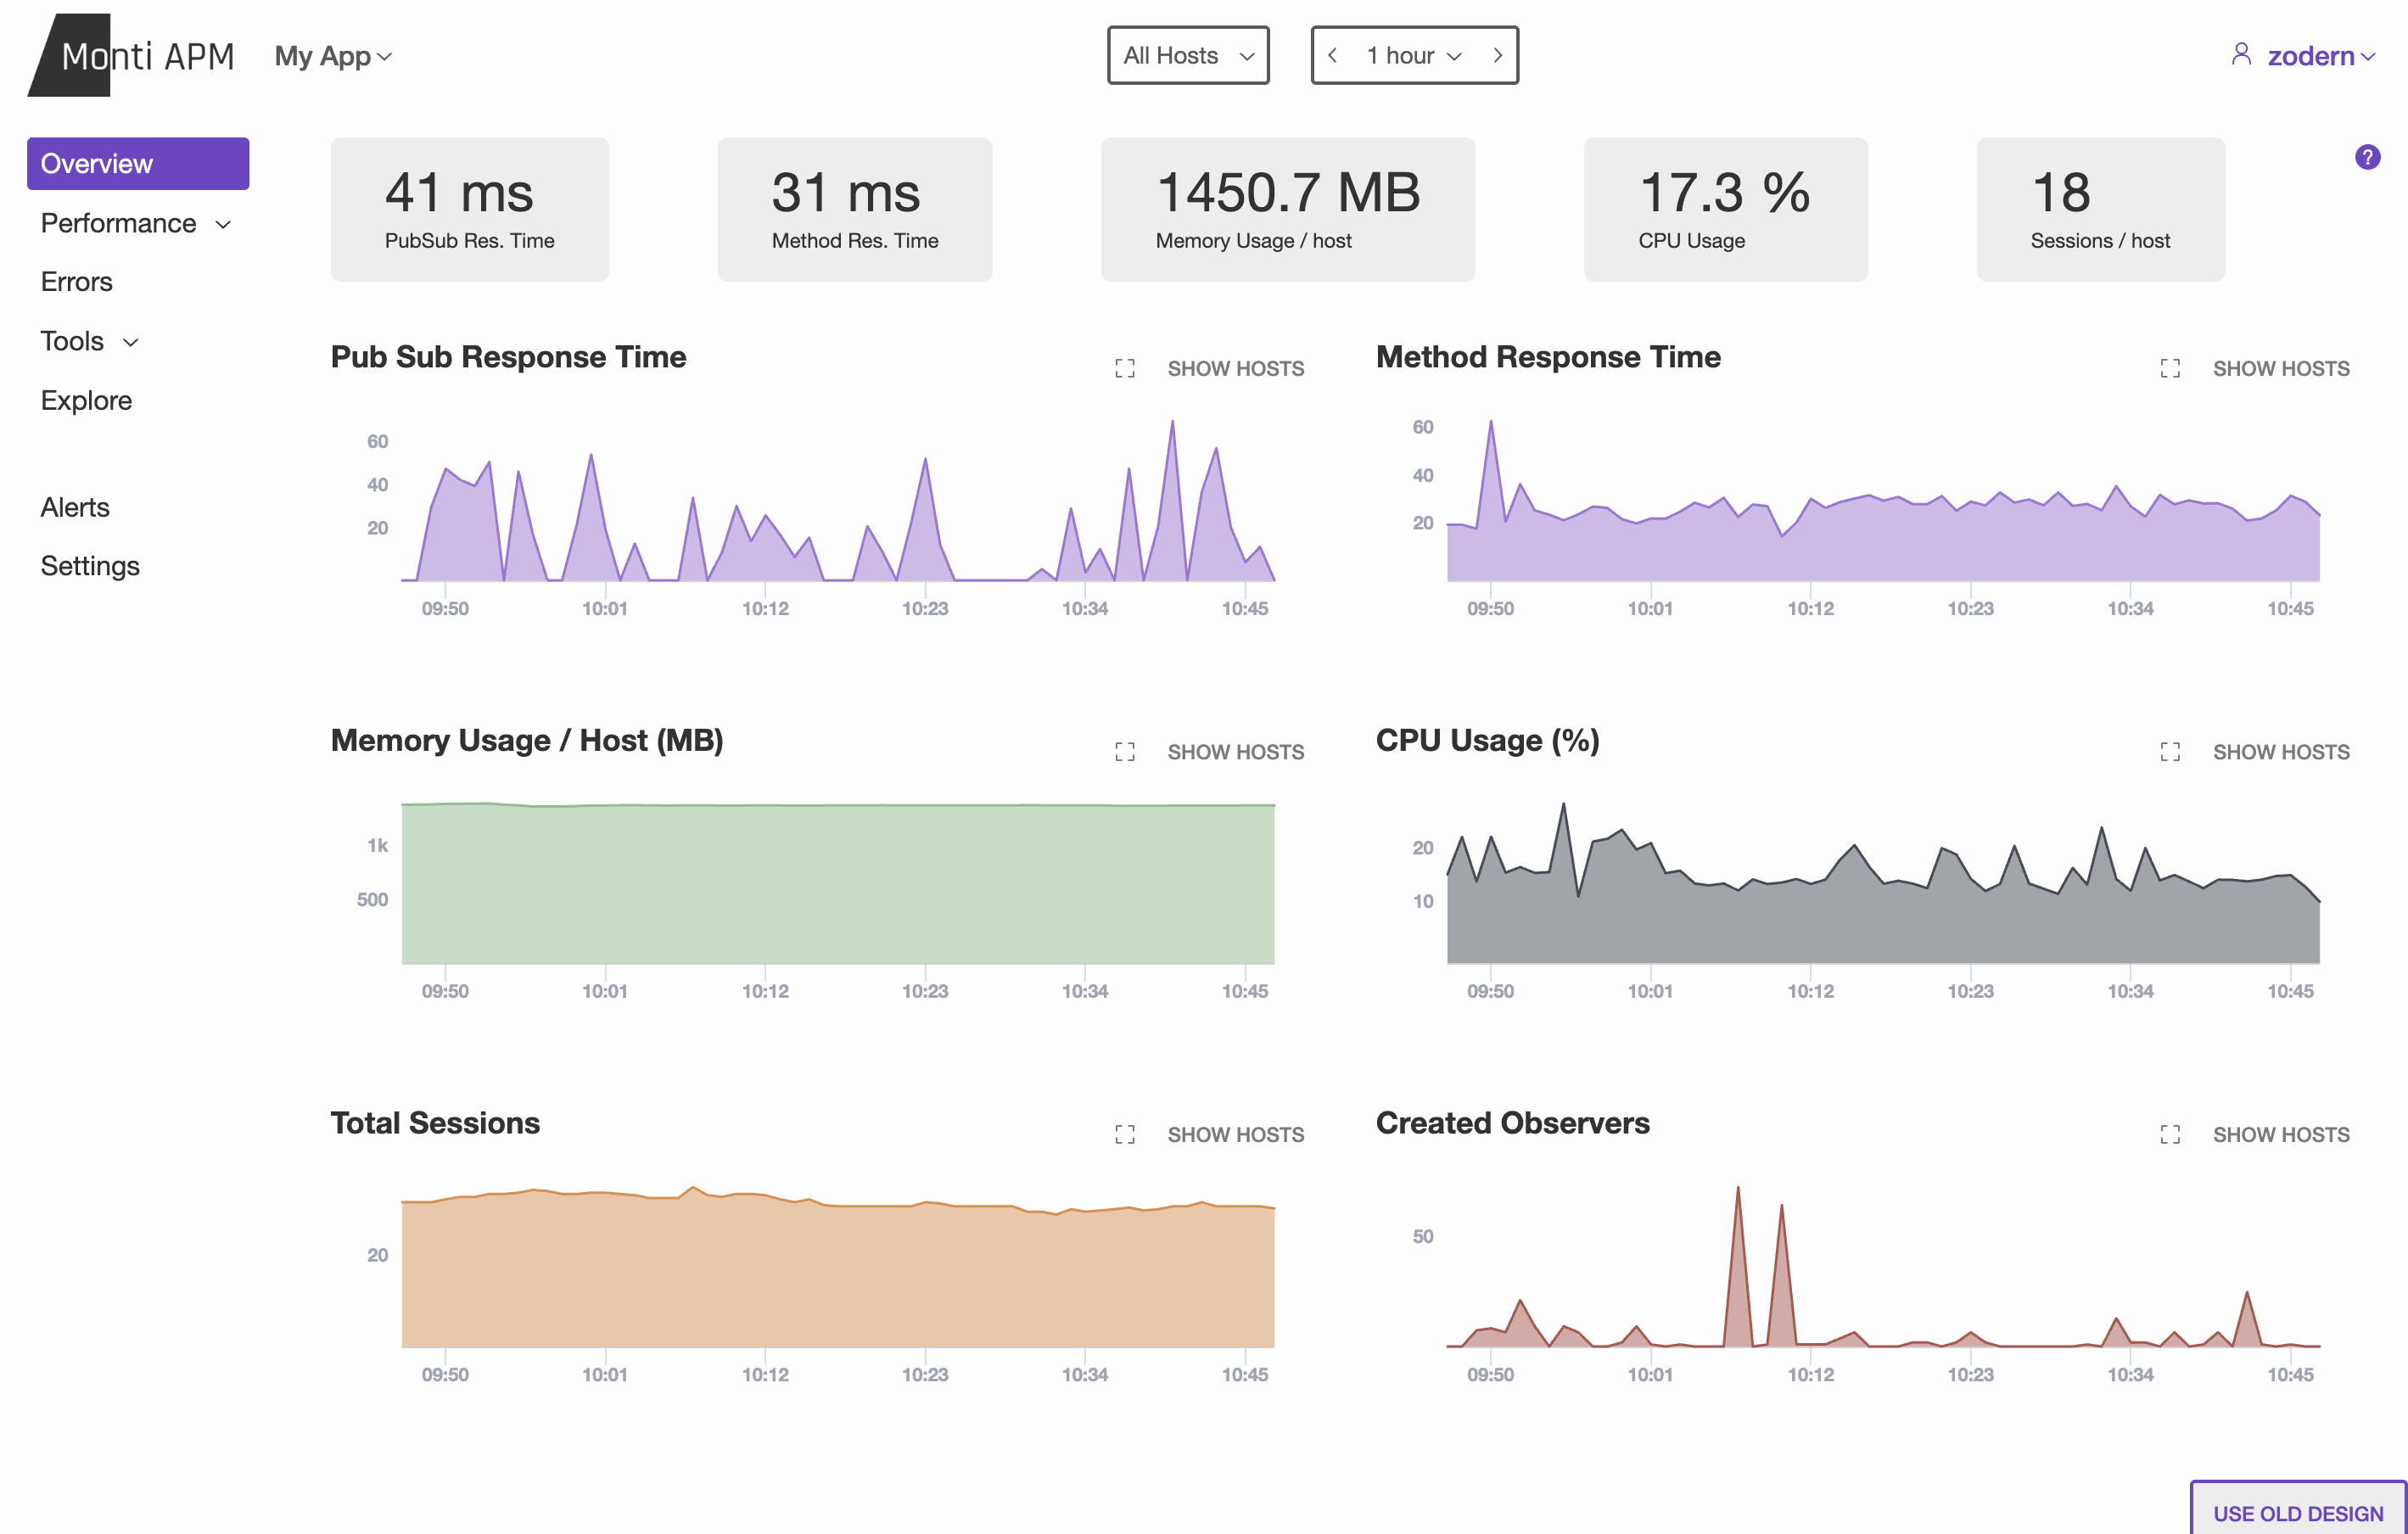
There's a lot that has changed. Here are the highlights:
Simplified header: All of the extra links are moved to either the app sidebar, or to the user dropdown. This gave us space to put the hosts filter, date/time selector, and other filters in the header. This new layout will make it easier to add more filters in the future.
App Sidebar: I loved the previous design of tabs, but it was non-standard, and didn't give us enough flexibility or room for our future plans.
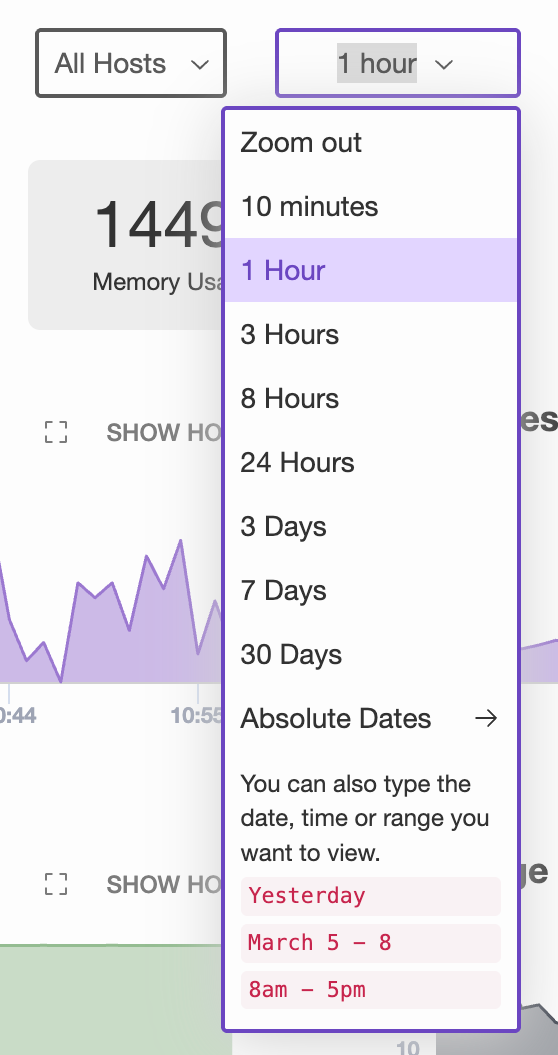
Simplified range selector, live mode, and date selector: Now this is a single dropdown. It lists common options for viewing live data. If you want something custom, you can type what you want, such as 90m or May 6 5-8pm. You can also use the absolute date option to select a specific date and time to start and stop at. To zoom in, you can now also drag to select a time range on any chart.
Simplified number formatting: This is a small detail, but something we paid attention to was simplifying how numbers were formatted. In the old design, the pubsub response time was 41.41ms, which is more precise than is helpful. The new design simply shows 41ms.
Performance Dashboards #
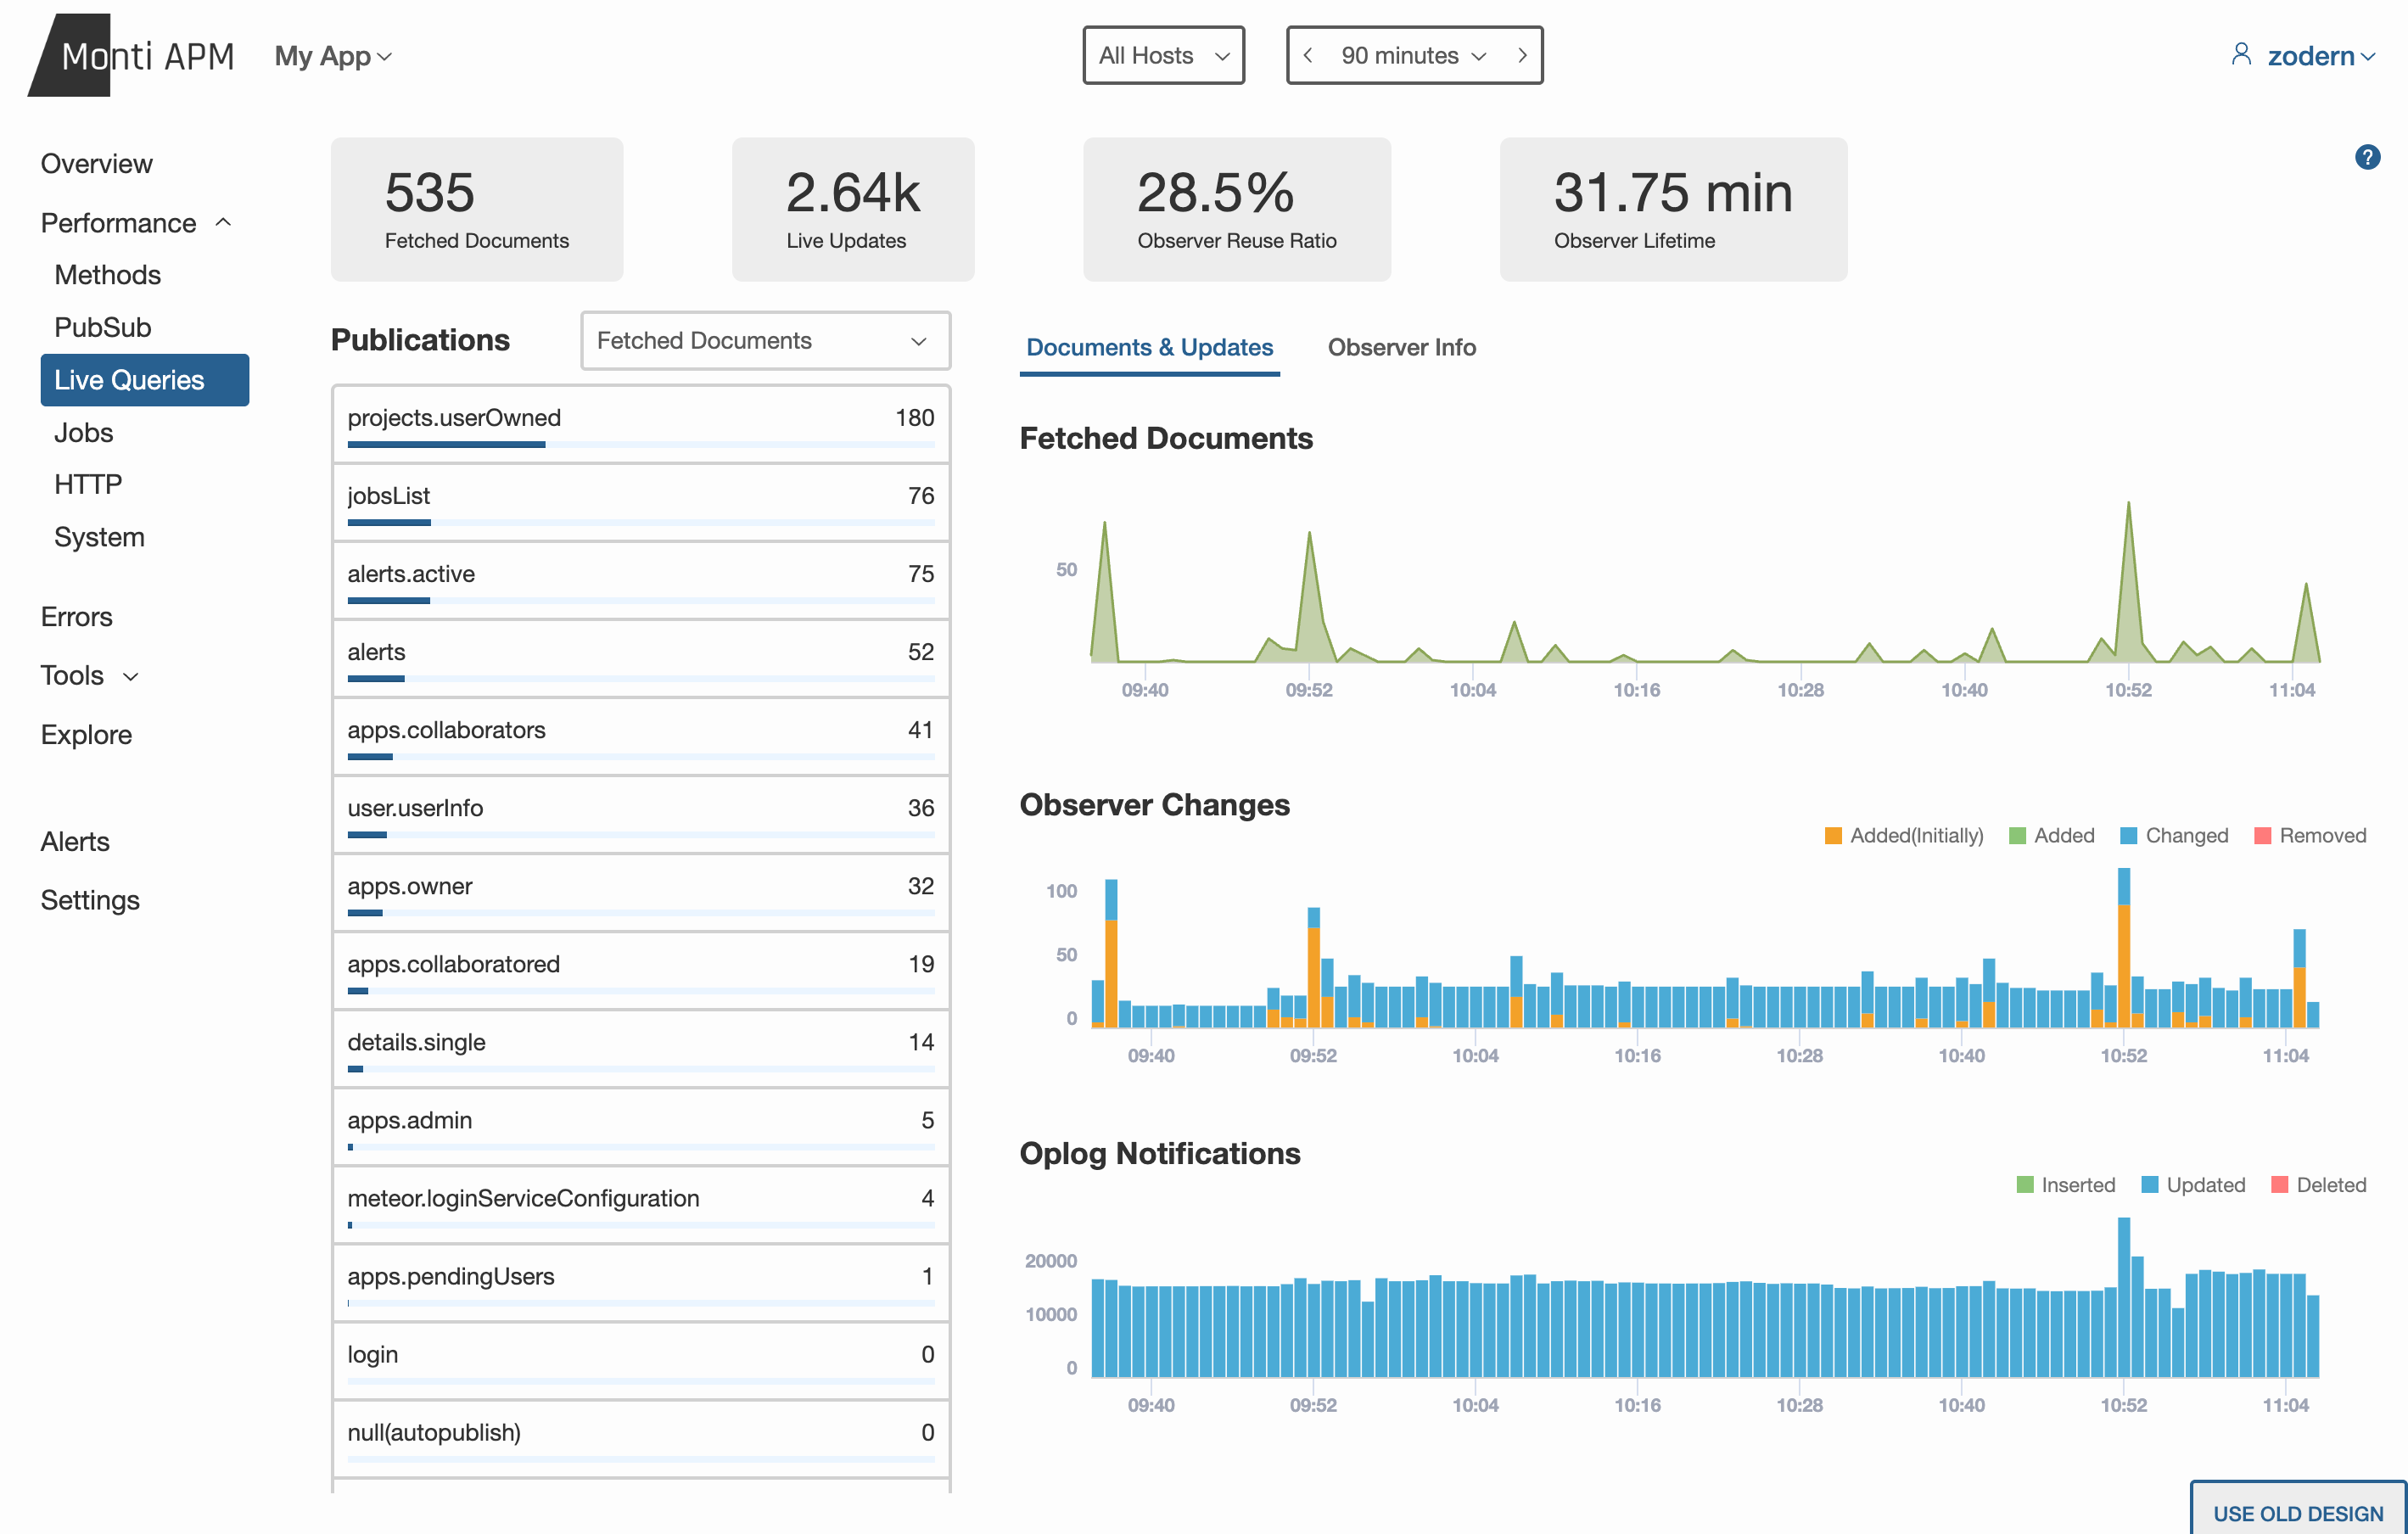
Most of the dashboards have been moved under a Performance section. These dashboards look very similar, but have a more refined UX. They have a standard 3 column layout, with each section scrolling independently, making it noticeably easier to navigate.
Heap Snapshots #
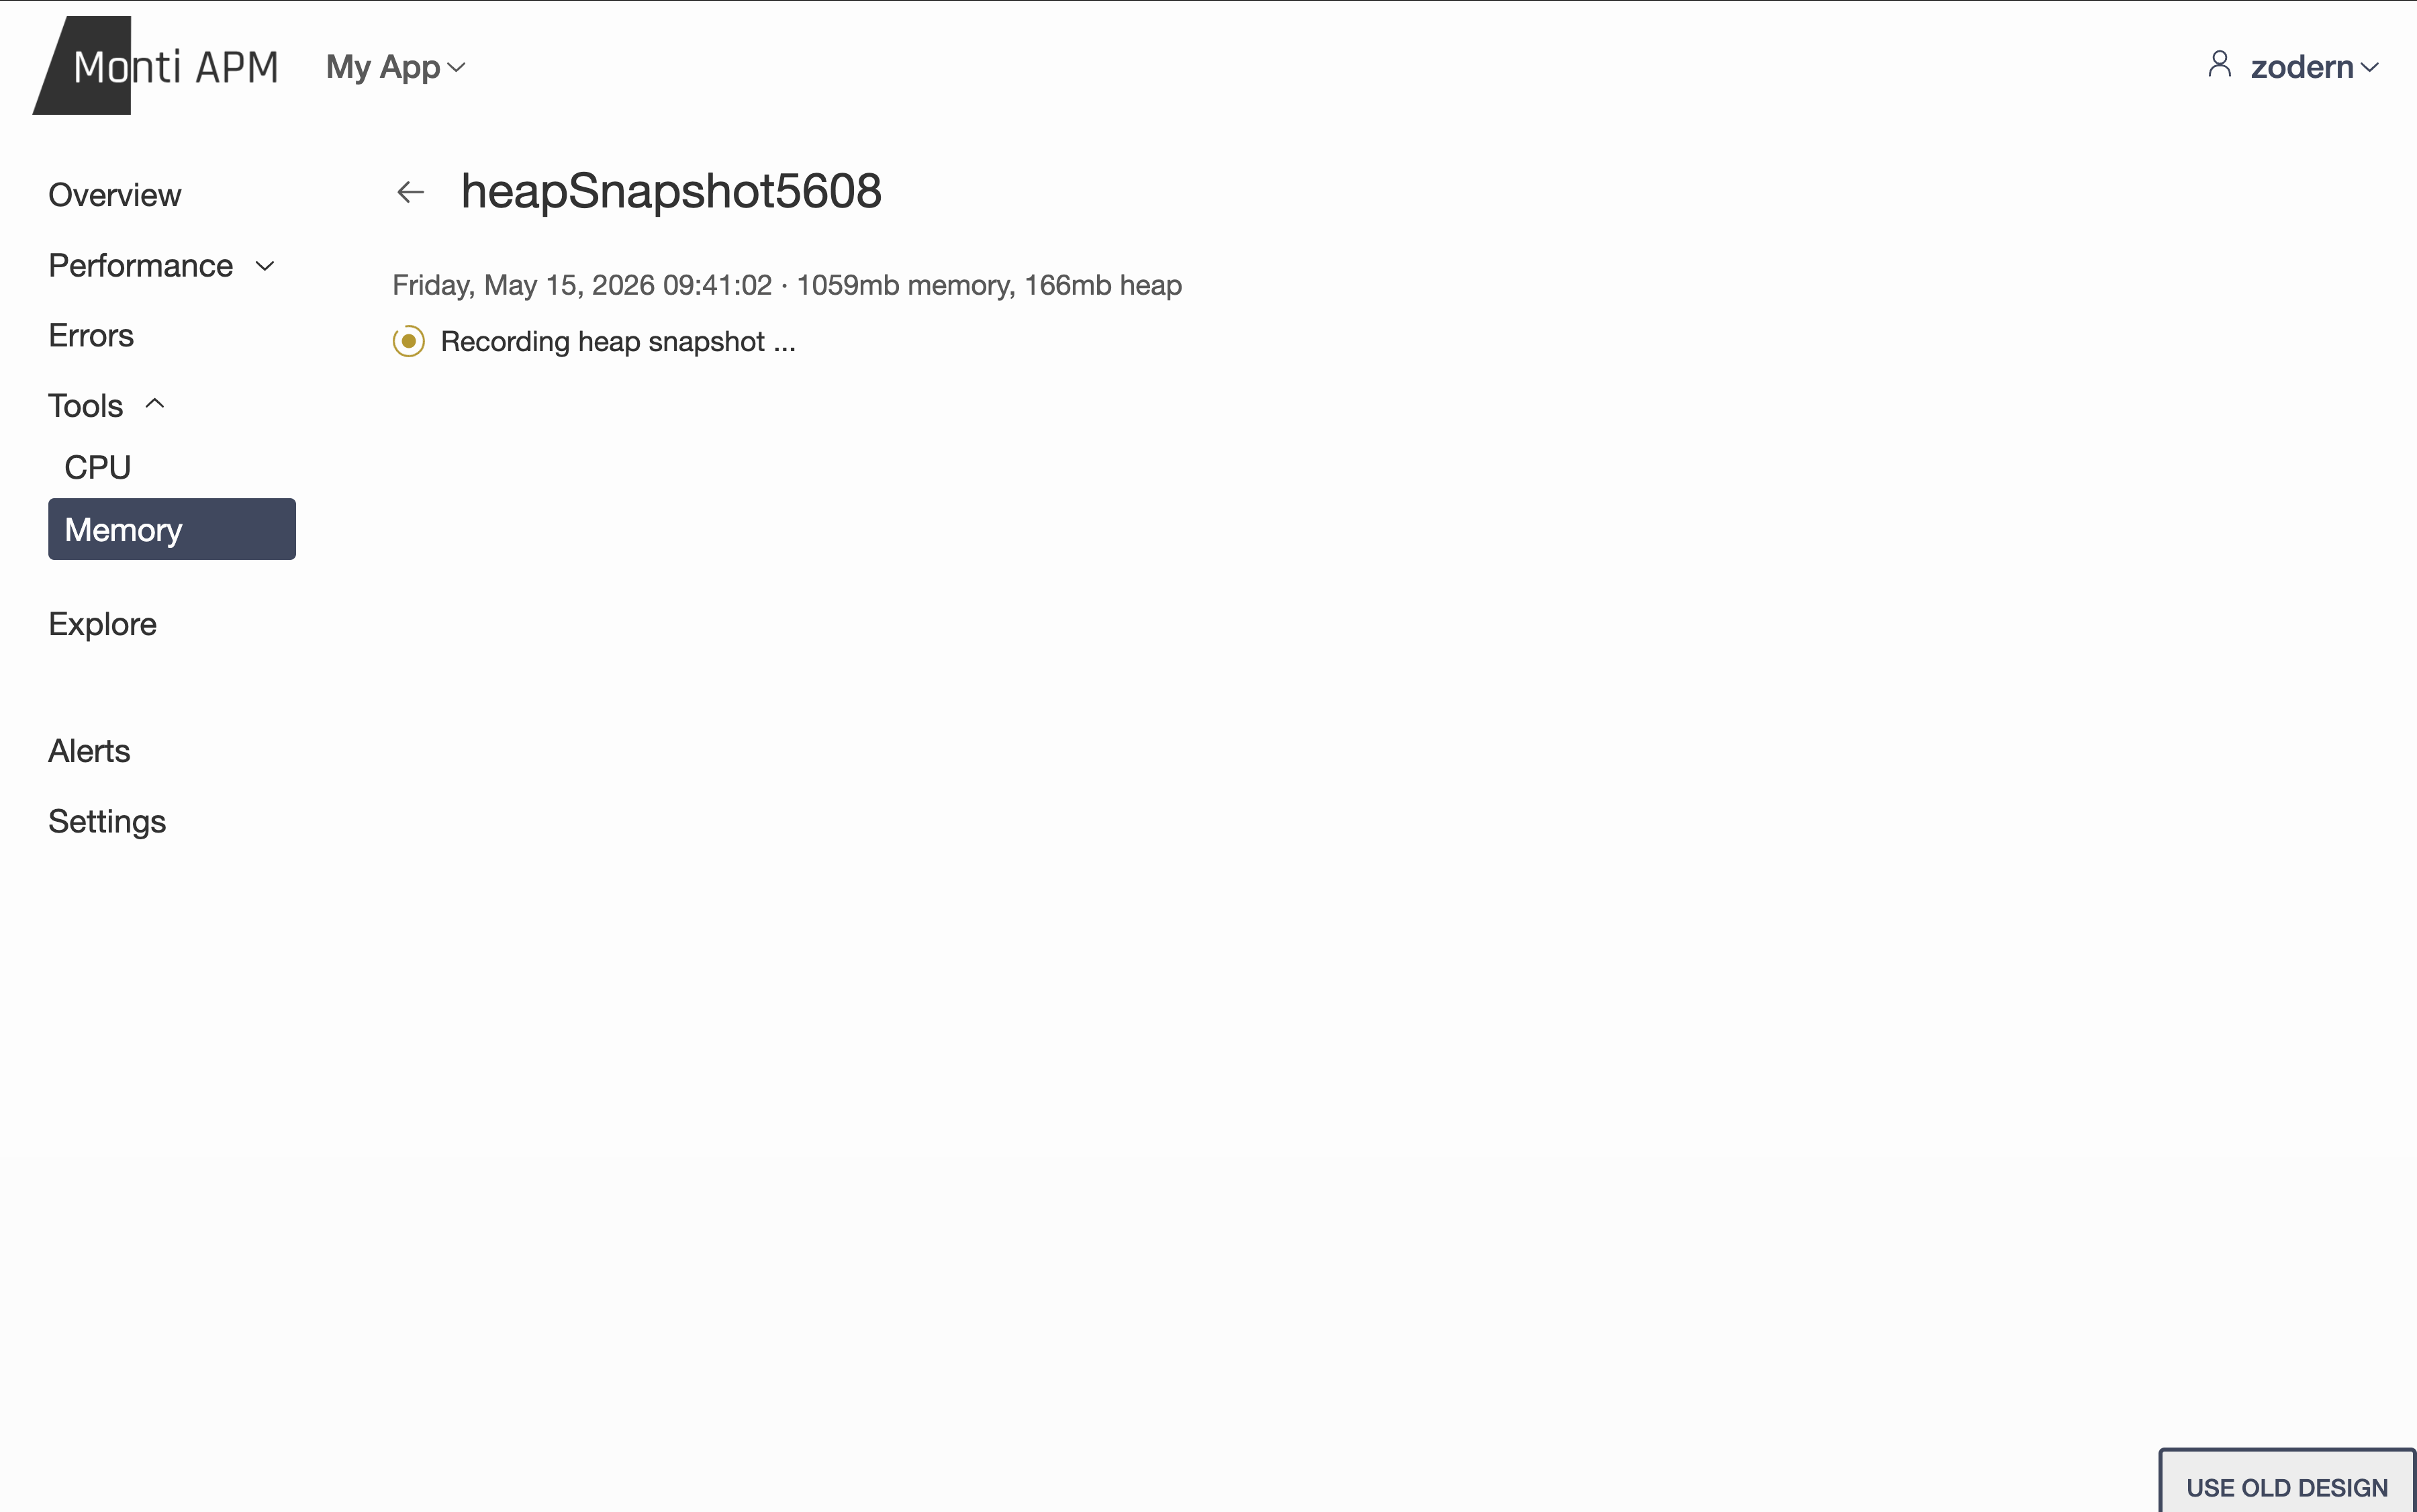
We've had tools for seeing exactly what is causing high CPU usage, and now we have tools to do the same for memory. You can remotely trigger a heap snapshot, and then download it to analyze in Chrome's developer tools or in other tools. We've put a lot of work into making this process reliable and simple. In the future, we'll add tools to analyze the heap directly in Monti APM.
CPU Profiler #
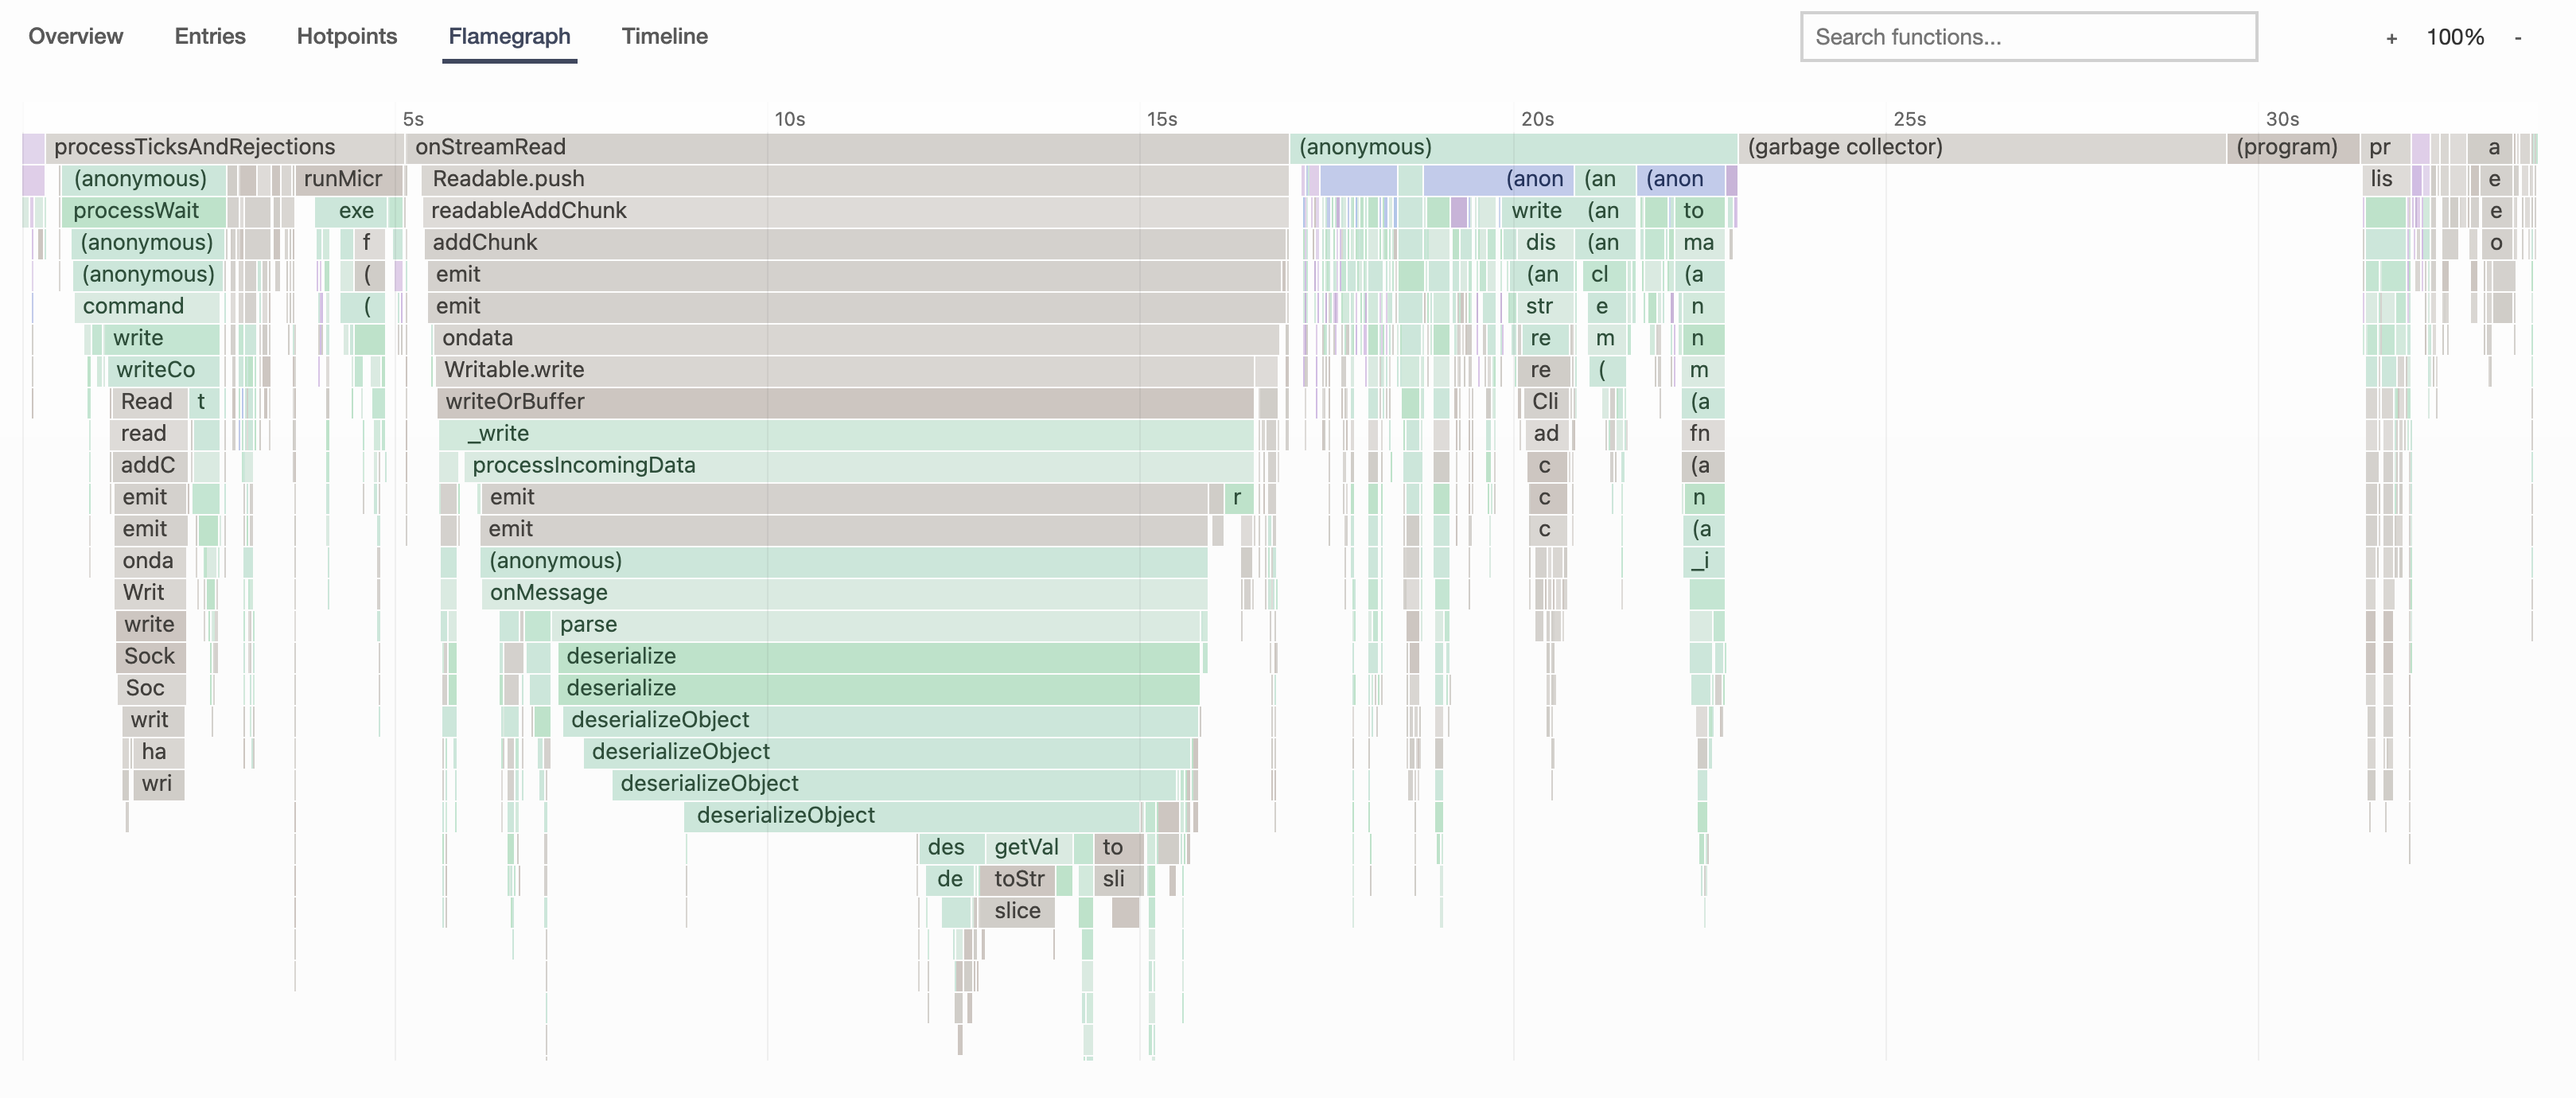
We've also significantly improved the process of taking remote CPU profiles. You can remotely trigger the profile and observe the progress, all in Monti APM. You can even select which host the CPU profile is recorded on, which was impossible in the previous design.
The CPU Profile Analyzer has been significantly improved. The flame graph and timeline are easier to interact with, and have a much cleaner design that makes the data clearer at a glance and easier to read.
Explore #
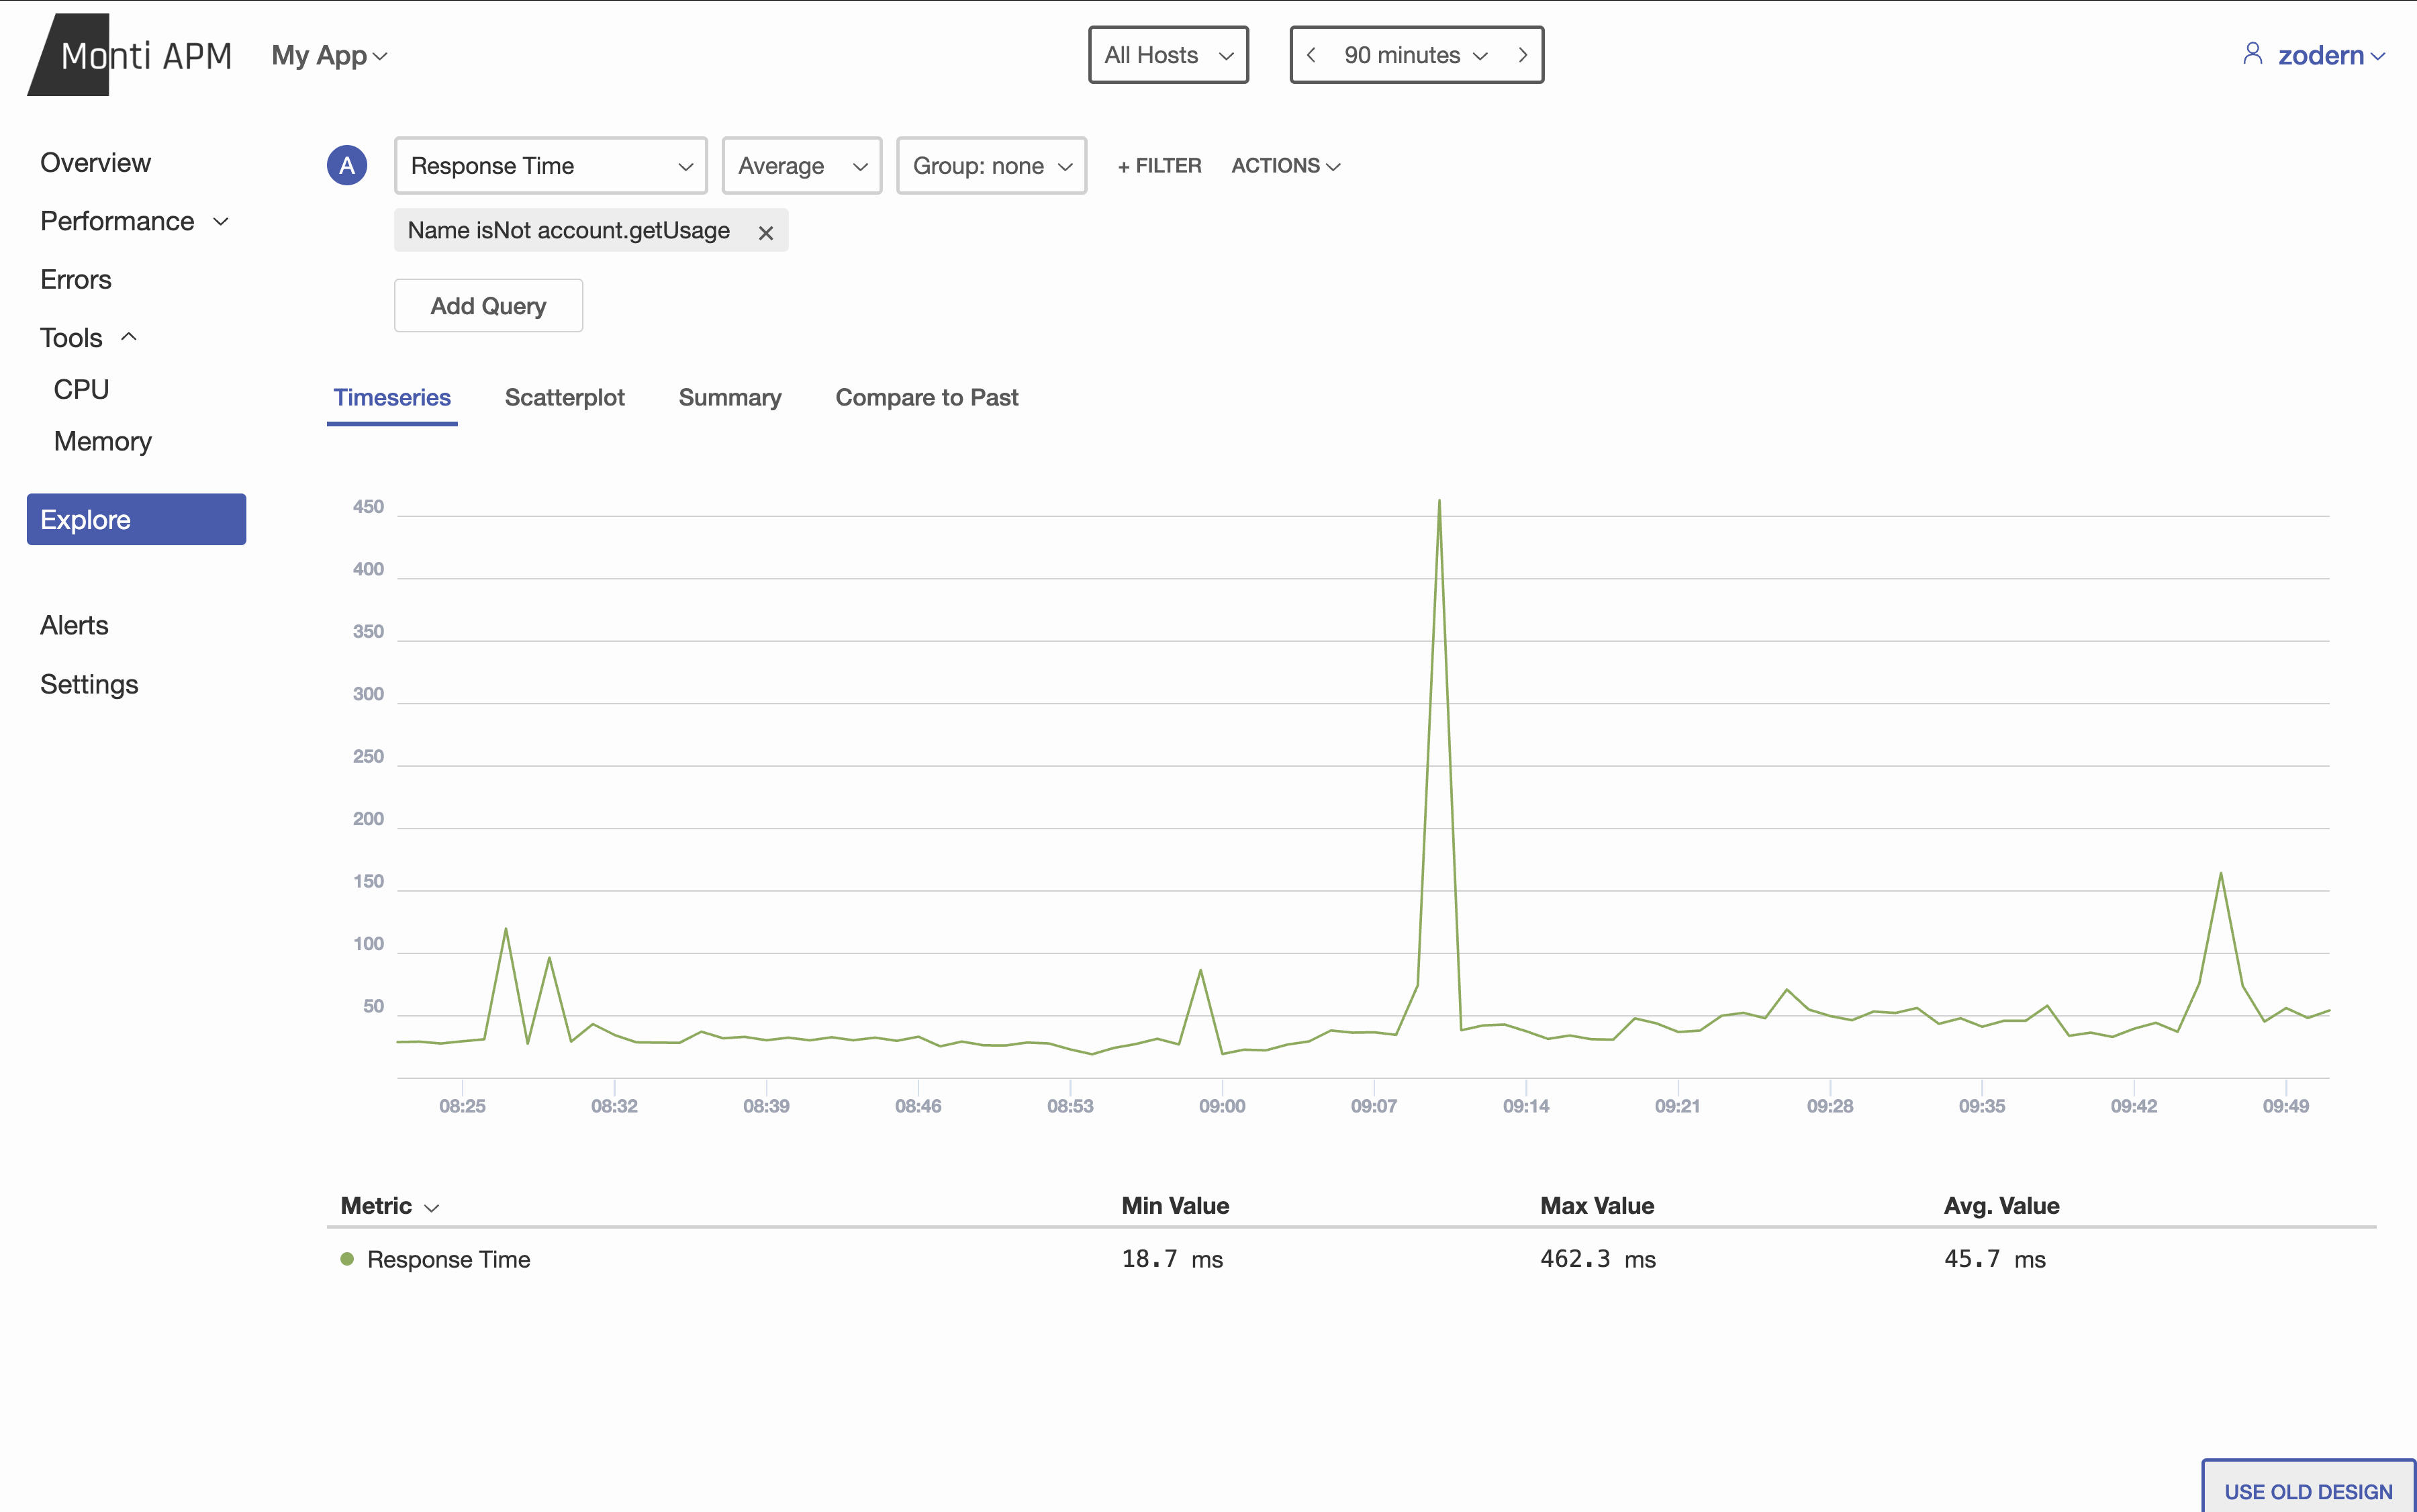
The previous explore never lived up to its potential. There were many metrics missing, and you were limited on how you could view, aggregate, group, or filter the data.
We now have a completely new explore page. All 100+ metrics are available. For each metric, you can choose how it is aggregated (do you want the average, the maximum value, rate per minute, 90th percentile, etc.) and how to group it (by name, host, error type, etc.). You can also use filters to choose what data to include or exclude.
We have 4 types of visualizations:
- Timeseries, which also provides a table
- Scatterplot to see the relationship between two metrics
- Summary, which shows you a single value per group
- Compare to Past, which shows you the current data, and the data from a previous time period
Share #
Adding collaborators to an app was surprisingly confusing in the previous design. There was a top-level Share button in the header, but this wasn't an obvious place or name so I received countless questions over the years on how to find this feature.
The new design puts it in Settings, which should be more intuitive to find.
There is also a new admin role. You can make someone an admin, and they can do almost everything the owner can do, except changing the owner.
Dark Theme #
Mobile UI #
More Features are Free #
There were a few small features that required a paid plan that are now available for everyone. Two examples are:
- error status (error is new, fixed, ignored, etc.)
- response time histogram
New Metric Query System #
A while ago we designed and built a new architecture for storing and aggregating metrics that is more flexible, faster, and more reliable. This redesign finished migrating to it. However, the way we queried metrics for the dashboard, API, and alerts hadn't been updated to take advantage of the new architecture, and was inflexible and limiting.
As part of this redesign, we built a new query system. The new system supports groups, filters, and all of the other flexibility we need. One of my favorite features is we can send a list of all of the metrics we need for a page, and the query system will plan out the most efficient way to collect all of the data. Previously, we had to manually do this when designing each dashboard.
Right now it's only used for Explore and the HTTP dashboard, but we're working on using it everywhere. It will make many more metrics available for alerts, and allow using filters with alerts (for example, monitor the response time of a specific method, exclude admin publications, etc.).
We are also working on a new API to make this available for integrations and MCP servers to use. If you are interested in trying out the new API, feel free to contact us.
What's Next #
In the short term, we'll be focused on polishing the new design, and building new features that benefit from the new metric query system (such as the API, better alerts, custom tags and metrics, and advanced filtering on all dashboards).
Afterwards, we have many ideas of what to build. If you want to provide suggestions or help us know what to prioritize, you can open or vote on issues in our new Feedback repository.
Have a comment? Please Send me an email
- Previous: File watching in Meteor
Want More? Join my monthly newsletter for new blog posts and news about Meteor and my projects.
Have a Meteor app in production? I run Monti APM for production monitoring to help improve performance and reduce errors.